
Insight

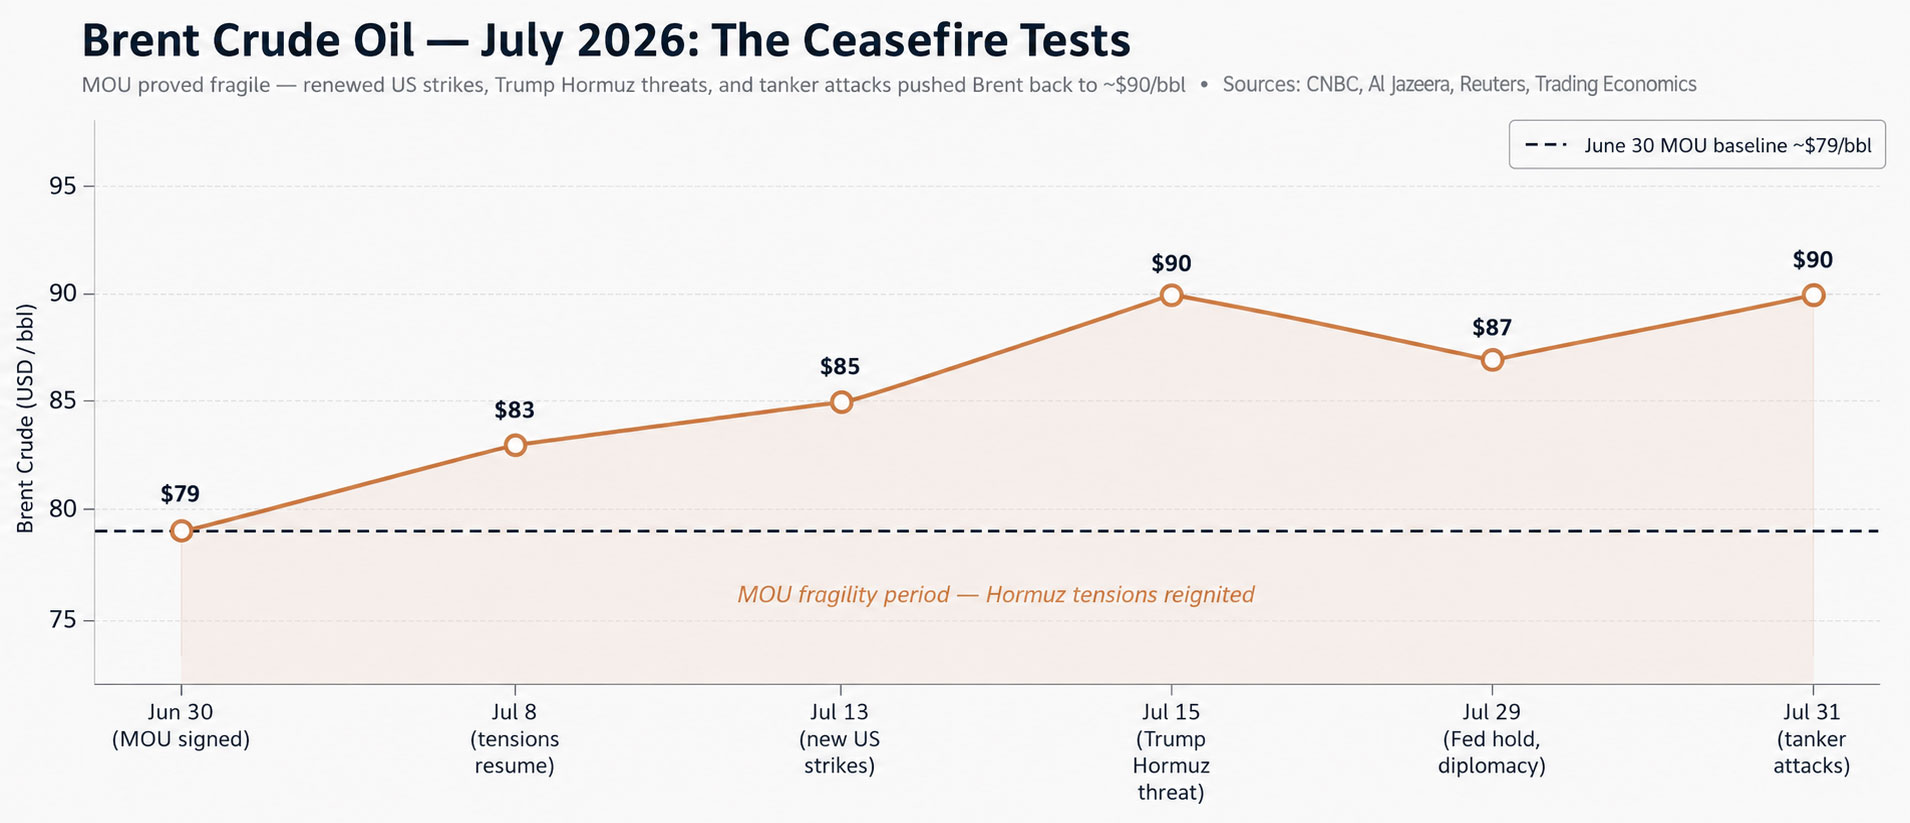
July 2026 delivers a sobering lesson in the fragility of peace dividends. The US-Iran Memorandum of Understanding, hailed in June as a historic breakthrough, proved to be precisely what sceptics warned it was: a framework without enforcement. By mid-July, renewed US military strikes on Iran, tanker attacks in the Strait of Hormuz and President Trump’s threat to reimpose a naval blockade had pushed Brent crude back above $90/bbl erasing much of June’s normalisation. The geopolitical premium, declared dead in late June, has quietly returned.
Yet the month is not simply a reversal of June’s themes. Beneath the geopolitical noise, the real story of July 2026 is the exceptional strength of corporate earnings. Q2 results are arriving at a pace and magnitude that have genuinely surprised even optimistic forecasters: an 86% EPS beat rate, blended earnings growth of 47.4% year-over-year(partly Alphabet-driven), and revenue surprises well above long-term norms. For Swiss-based investors, the challenge of July is to hold these two realities simultaneously: a world where oil risks are higher than June suggested, and one where the underlying corporate engine of global equity markets remains powerfully in motion.
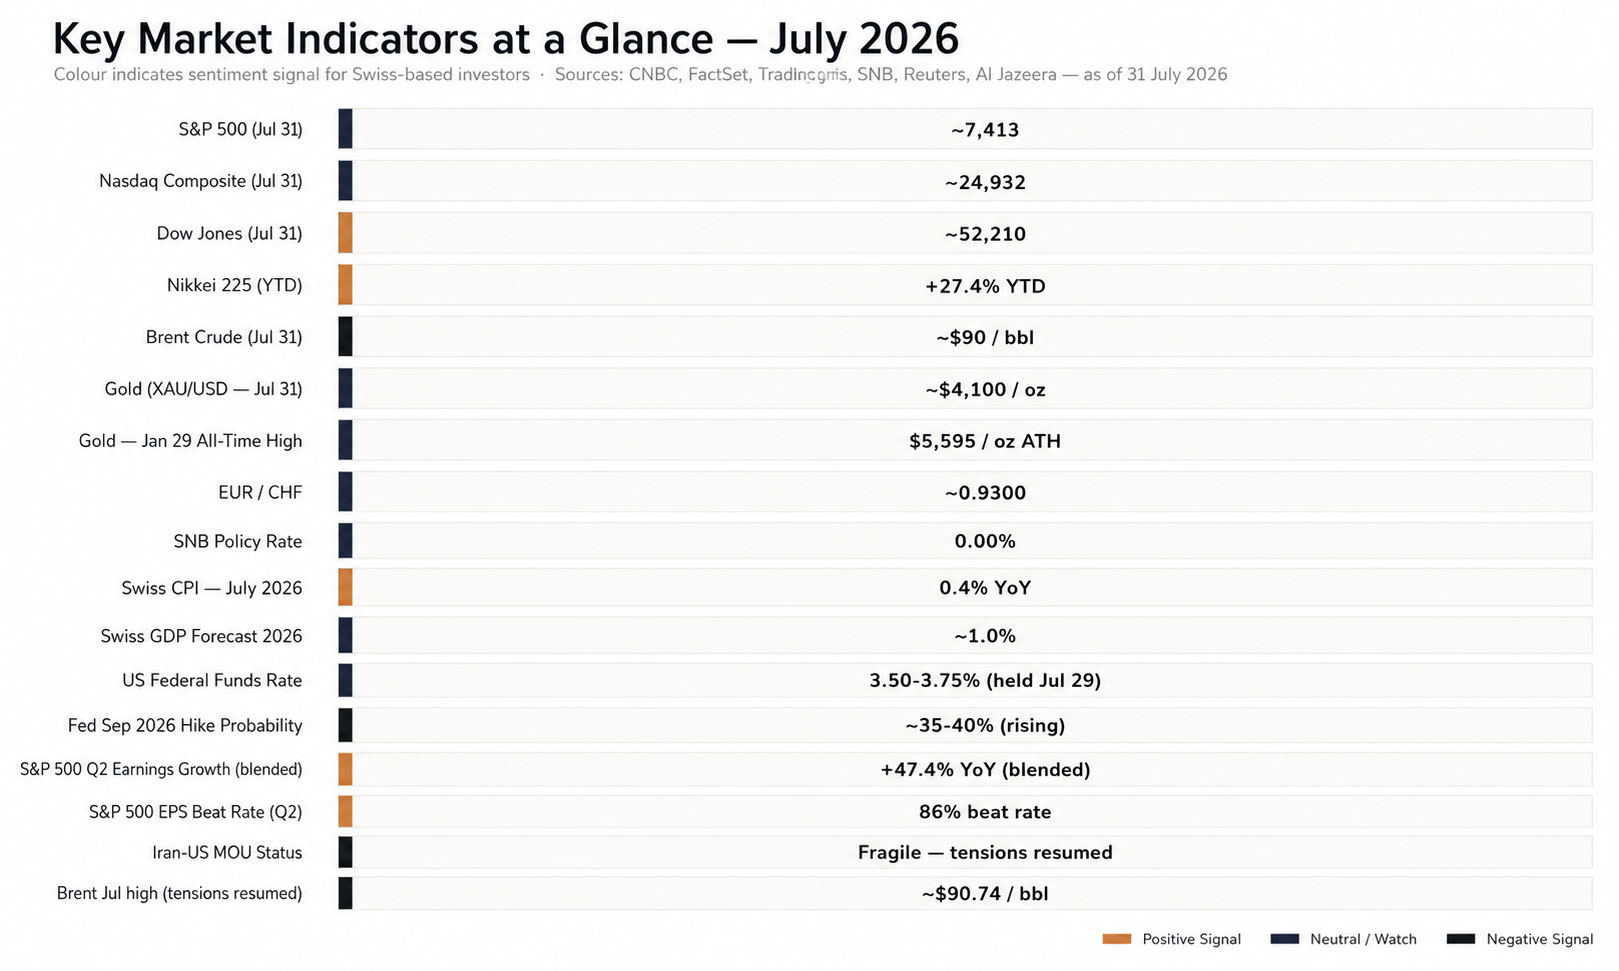
July 2026 Key Market Indicators at a Glance
The MOU Under Pressure
The June 17 Memorandum of Understanding was never a peace treaty. July’s events have confirmed exactly that. Within two weeks of its signing, the geopolitical architecture began to fracture.
On July 8, Brent crude rose 8% in a single session as Trump declared the US-Iran deal ‘over’ and threatened to reimpose the naval blockade of the Strait of Hormuz. US airstrikes resumed, targeting over 80 sites inside Iran. By July 13-14, Brent had climbed to approximately $85-86/bbl its highest level since June 15 as US and Iranian forces exchanged attacks directly over the strait. Iran’s Revolutionary Guard Corps struck tankers attempting to transit under US military escort. Trump warned Iran it would ‘get a beating.’ Markets responded accordingly.
The month’s second half saw cautious diplomatic re-engagement. By July 28, falling oil prices reflected renewed Iran-Saudi Arabia-Oman dialogue on Hormuz management. The Fed’s July 29 rate hold and subsequent diplomacy provided a brief stabilisation but by July 31, fresh tanker attacks by Iran pushed Brent back to $90.12/bbl. The ceasefire has become a cycle: flare-up, de-escalation talk, flare-up again.
What this means structurally
The Strait of Hormuz risk premium is not an event, it is a condition. The corridor through which approximately one-fifth of global seaborne oil trade flows has been politicised in a way that cannot be quickly un-politicised. For portfolio construction purposes, the assumption of normalised energy supply cannot be the baseline for H2 2026. Energy price volatility must be treated as a structural feature of the investment environment, not a temporary distortion.
Global Markets: Earnings Excellence Meets Oil Headwinds
July’s equity market story has two chapters running simultaneously and they pull in opposite directions. The extraordinary strength of Q2 corporate earnings is the positive; the resumption of geopolitical oil risk, the constraint. The net result is a market that is broadly positive over the month; the S&P 500 closed July at approximately 7,413, the Dow at 52,210 but one that has struggled to sustain momentum in the face of renewed geopolitical uncertainty.
United States: Earnings Season Outperformance
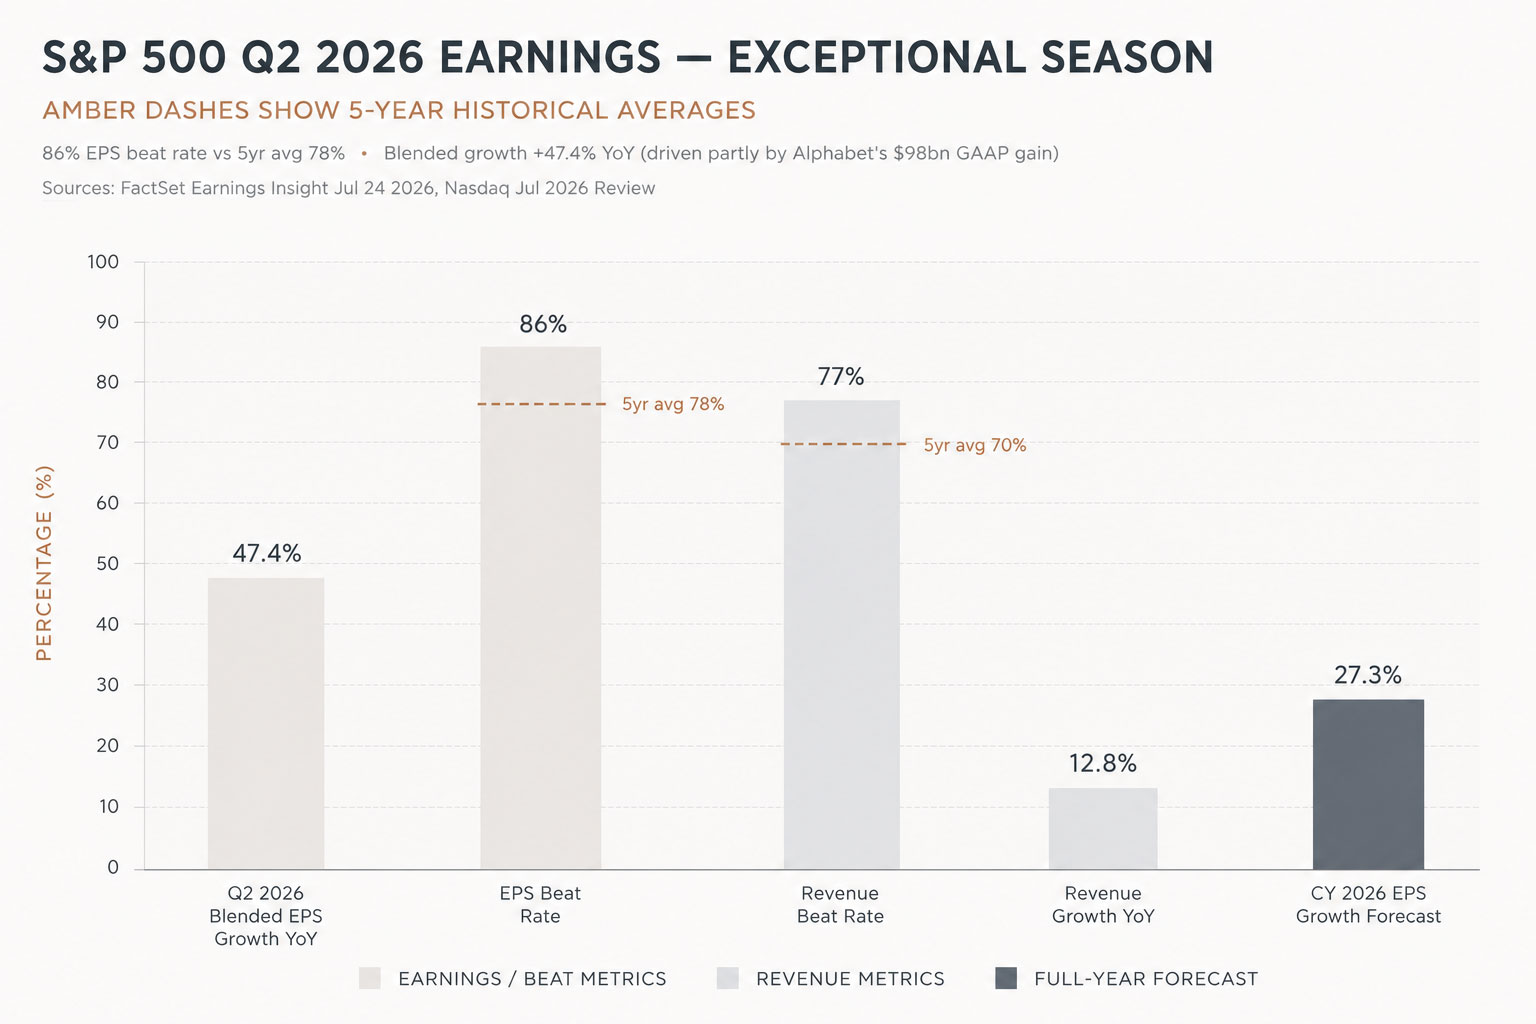
Q2 2026 is shaping up as one of the strongest earnings seasons on record. As of July 31, 61% of S&P 500 companies had reported, with 86% exceeding EPS estimates against a five-year average of 78%, and 77% exceeding revenue estimates against a historical norm of 70%. The blended earnings growth rate stands at 47.4% year-over-year though this headline is partially inflated by Alphabet’s extraordinary $98 billion GAAP gain. Excluding Alphabet, the blended rate falls to approximately 25.9%, still a highly impressive figure. Revenue growth of 12.8% year-over-year would mark the highest since Q2 2022 if it holds.
Sector leadership is broadening, which is encouraging structural development. Goldman Sachs surged 9% on a significant earnings beat; Coca-Cola gained 5% on top-and-bottom-line strength; Sherwin-Williams rose 8% on strong Q2 results. This is not merely a technology story ten of eleven S&P 500 sectors are reporting year-over-year earnings growth. For Swiss-based investors, broader earnings participation is a more sustainable foundation for equity allocation than the narrow mega-cap concentration that characterised earlier 2026 gains.
United States: The Fed’s Most Divided Vote Since 2016
The July 29 FOMC meeting held rates at 3.50-3.75% in a 9-to-3 vote, the most divided decision since 2016. Three dissenting members favoured an immediate hike. While the hold was in line with market expectations, the dissent count and the committee’s language on inflation risks shifted the debate firmly toward whether the Fed hikes in September, not whether it cuts. Rate cuts are now off the table for 2026 across every major Wall Street institution. The only live debate is between hold-for-the-year and one-more-hike.
Post-meeting gold initially reacted positively, rising toward $4,130/oz on July 30. The June PCE data, released simultaneously, came in broadly in line preventing an immediate tightening signal. But the structural direction of US monetary policy is unambiguous: tighter-than-expected, firmer-for-longer.
Global Equities
Japan’s Nikkei 225 remains the standout global performer with a 27.4% year-to-date gain through July 20 — a figure driven by a combination of AI and technology exposure, a structurally weaker yen improving corporate competitiveness, and Bank of Japan policy that remains accommodative relative to peers. Canada’s TSX has gained 10.2% year-to-date. The S&P 500 has delivered 8.7% through the same period. In contrast, India’s BSE Sensex is down 8.8% for the year, and China’s Shanghai Composite has lost 1.9%. The global equity map continues to reward market selection over passive global exposure.
Gold Consolidation Above $4,000 – The Base Holds
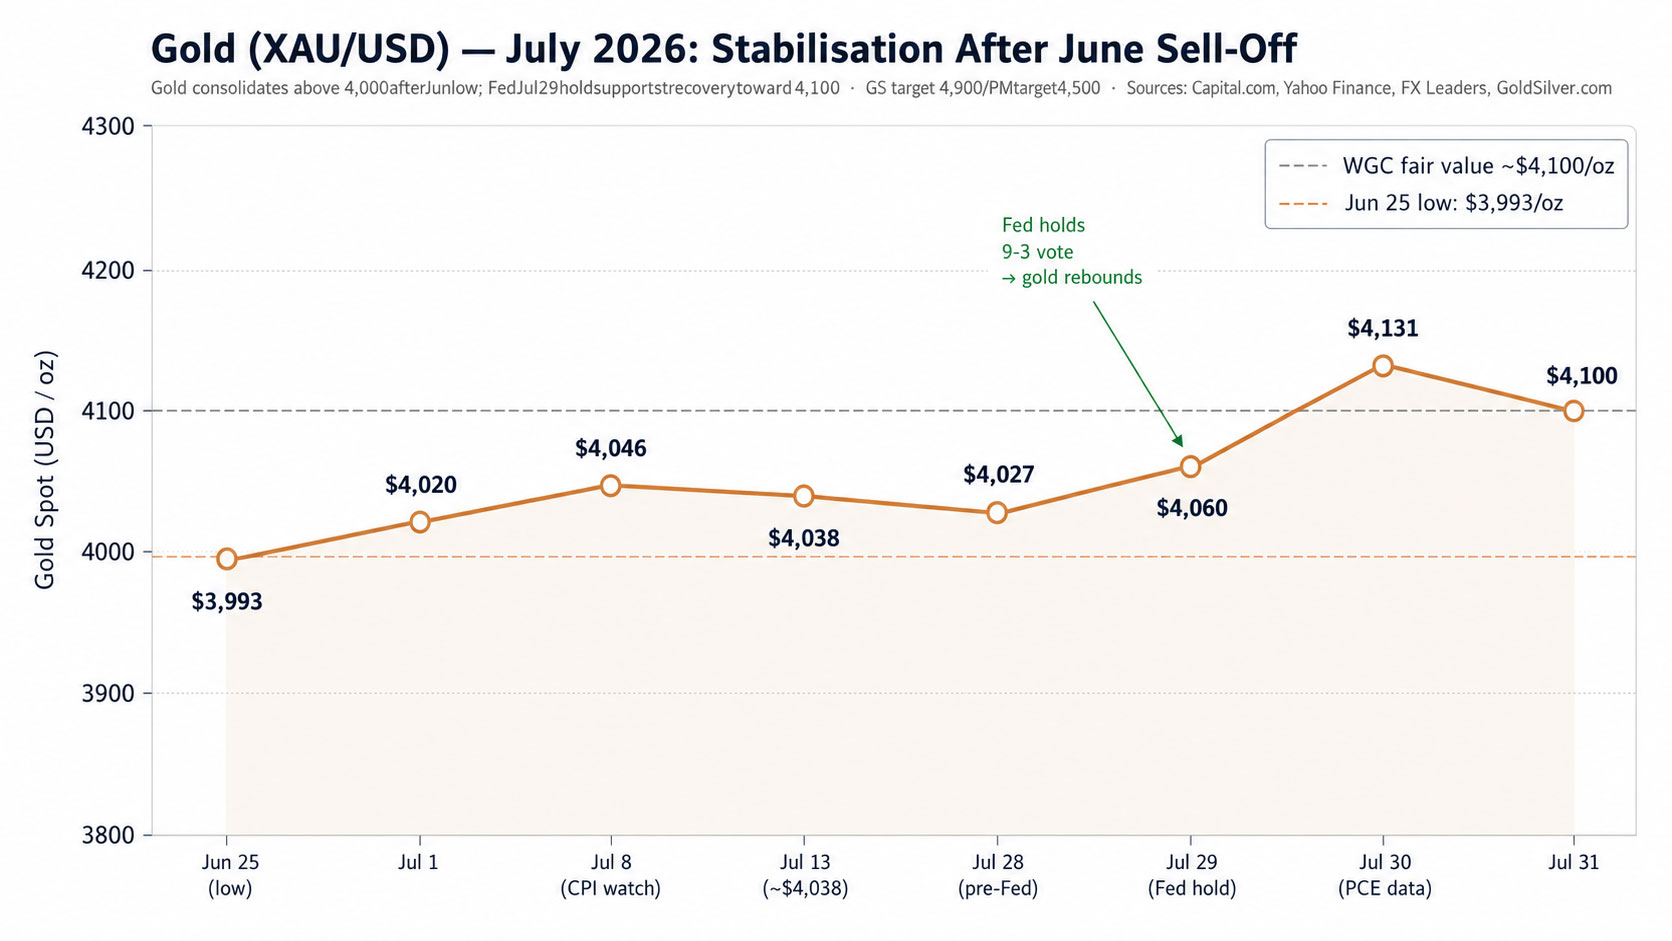
After June’s dramatic sell-off from $5,595/oz to a low of $3,993, July has brought stabilisation. Gold has traded in a range of approximately $3,993 to $4,131 through the month, finding support above the psychologically important $4,000 level. The World Gold Council’s fair value framework places gold at approximately $4,100/oz and July’s price action has converged precisely toward that level.
The July 29 Fed hold catalysed the clearest upward move of the month. Gold futures crested $4,100 on the morning of July 30, as the combination of a consensus decision (hold) and an in-line PCE print reduced near-term pressure from rate-hike expectations. The structural bull case for gold central bank accumulation (China made its 20th consecutive monthly purchase in June), US fiscal concerns and residual geopolitical risk remains intact even as the tactical environment has been challenging.
Divergence Between Institutional Forecasts
The range of institutional gold forecasts for year-end 2026 remains wide, reflecting genuine uncertainty about the path of US monetary policy and geopolitical risk. Goldman Sachs has revised its year-end target to $4,900/oz; JPMorgan targets $4,500 for Q4. Both remain meaningfully above current levels and both institutions maintain that the structural case for gold is intact. The bear case centres on a September Fed rate hike materialising — which would raise real yields further and increase the opportunity cost of holding non-yielding gold. Monitoring August and September CPI prints will be the most critical near-term input for positioning.
For Swiss-based investors, gold’s CHF-denominated return profile remains complex. The EUR/CHF has moved from 0.9144 in late June to approximately 0.9300 by early August a notable shift toward a weaker franc. If geopolitical de-escalation progresses and safe-haven demand for CHF further normalises, this CHF depreciation pressure could partially offset gold’s USD-price recovery for unhedged Swiss investors. Currency overlay remains an important consideration.
Widening Divergence Creates Opportunity
July has sharpened one of the most interesting structural dynamics in Swiss investing: the widening inflation divergence between Switzerland and the eurozone. Swiss CPI fell to 0.4% in July, its lowest level in four months, while eurozone inflation climbed back to 2.9%, driven by energy prices up 10% year-on-year. This creates a gap of 2.5 percentage points, the widest in recent memory, and it has direct implications for monetary policy divergence, the EUR/CHF trajectory, and the relative attractiveness of Swiss assets.
SNB vs ECB: Diverging Paths
The European Central Bank raised its deposit rate to 2.25% on June 11 its first hike since 2023 and paused on July 23, with markets now pricing up to two further ECB hikes before year-end. The SNB, by contrast, is expected to remain at 0.00% through 2026 and potentially through 2027, with the IMF’s June 2026 Article IV consultation projecting inflation remaining subdued at 0.6-0.7% through 2028. This SNB-ECB divergence has supported EUR/CHF moving from 0.9144 toward 0.9300 a directional shift that reflects partially fading CHF safe-haven demand and the widening interest rate differential.
The UBS economist consensus targets EUR/CHF at 0.95 by year-end 2026. A move of that magnitude would represent a meaningful tailwind for CHF-based portfolios holding unhedged eurozone assets and a partial offset for Swiss exporters who have faced headwinds from franc strength. It would also compound the importance of active currency management for Swiss-based investors holding international allocations.
Swiss Economic Resilience
Switzerland’s economic fundamentals remain among the most stable in the developed world. The IMF’s June 2026 Article IV consultation noted that Switzerland’s strong policy frameworks and economic flexibility have supported stability through global volatility with exports remaining resilient and the impact of the energy price shock milder than in neighbouring countries. GDP growth of approximately 0.8-1.0% is forecast for 2026, recovering to 1.5% in 2027. Inflation at 0.4% in July is well within the SNB’s 0-2% target range, providing continued policy flexibility.
The strong franc, rather than being purely a constraint, has acted as a buffer: it has mitigated upward pressure on inflation from energy prices, and it has kept import costs contained. For investors based in Switzerland, this domestic stability provides a platform from which to take selective international risk particularly in European equities at lower valuations, and in AI-adjacent structural themes.
Navigating the Post-War Complexity
The defining strategic insight from July 2026 is that the world has not moved cleanly from a geopolitical risk regime to a normalised one. The ceasefire has fractured; the MOU has tested; and energy markets have reminded investors that the Strait of Hormuz is not a solved problem. At the same time, corporate earnings are delivering at a level that validates equity exposure in a selective, disciplined framework.
The strategic framework for H2 2026 builds on the five principles established in our June inaugural report but July’s data adds important nuance to each.
Five Principles
Final Thought
July has taught us something important: in geopolitics, as in markets, the first deal is rarely the last word. The US-Iran MOU was a genuine breakthrough and it remains a genuine opportunity. But it has also confirmed that navigating the post-conflict transition requires patience, discipline, and a tolerance for ambiguity that short-term market positioning rarely accommodates.
The juxtaposition at the heart of July 2026 is striking: corporate earnings are delivering at a pace not seen in years, validating the underlying strength of global businesses. And yet the geopolitical backdrop that most investors assumed was on a path to resolution has proved more persistent than the MOU suggested. Holding both truths simultaneously the fundamental strength and the structural uncertainty is the analytical challenge of H2 2026.
Quality over consensus, income over speculation, diversification over concentration. The Swiss platform low inflation at 0.4%, stable institutions, and a central bank with genuine policy flexibility provides a strong foundation. From that foundation, selective exposure to the themes and geographies where the current environment creates genuine opportunity earnings-driven US equities, structurally positioned Japanese markets, and gold’s long-term structural bid is the framework that serves investors well through the complexity ahead. “In geopolitics, as in markets, the first deal is rarely the last word. The investors who navigate this best are those who expected as much.”
Commentary by AIX Group AG
Disclaimer
The above market analysis/information is produced for information and knowledge purposes only under personal capacity, and does not constitute any liability or obligation upon the readers or the firm to take investment decisions. Professional investors only.
References and Sources

Please select “AGREE & CONTINUE” below: By clicking the “AGREE & CONTINUE” button below, you warrant that you acknowledge that you have read and understood the Terms and Conditions and Terms of Use and agree to be bound by their terms.